How to run structural analysis on Packhunt
Introduction
Would you like to run structural analyses in a web browser and display the results? Then use these Packhunt components with the Karamba3D plugin in your solution by following these steps.
Prerequisites
Before you start, make sure:
- You have the latest Packhunt plugin installed.
- You have Karamba3D installed.
❗ Karamba3D is a paid service, therefore a paid Packhunt account is needed to run its components in a solution. However, for now members of our Early Adopter Program are able to use it for free.
1. Run structural analysis with Karamba3D
- Define the necessary inputs for your structural analysis.
- Run the structural analysis locally in Grasshopper with the Karamba3D plugin.
2. Display results and annotations in Packhunt
Packhunt’s annotation components can be used to show necessary information about the design like loads, element tags and deformations in the viewer. You can display arrows, texts, angular dimensions and coloured meshes by following the steps below.
See the truss below with arrows, angular dimensions and coloured meshes as an example.
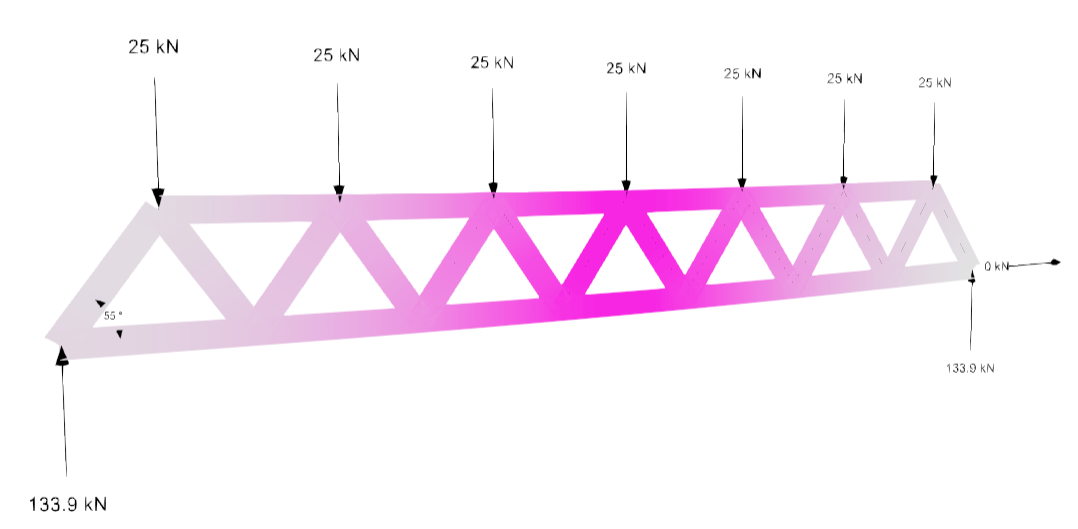
Displaying arrows
You can display arrows in the viewer to represent loads and reaction forces.
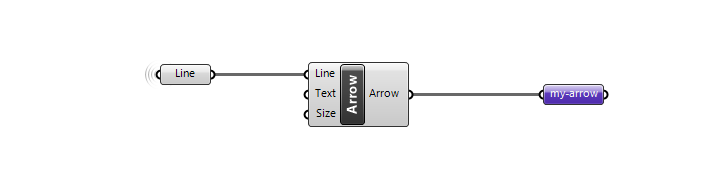
- Define the line(s) that should be replaced by the arrow(s) in Grasshopper.
- Connect the line(s) to the
Arrowcomponent. - Connect the
Arrowcomponent to theData outputcomponent as shown below.
Displaying text in the viewer
You can display text in the viewer to tag structural elements.
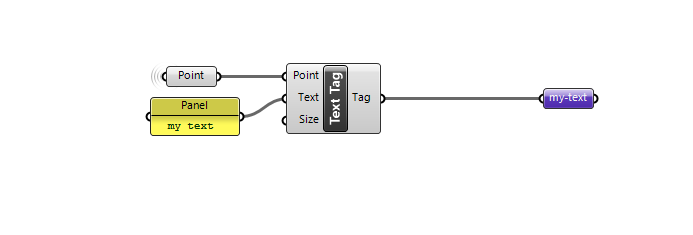
- Define the text that should be displayed in Grasshopper.
- Define the desired point location for the text.
- Connect the text and its location to the
Text tagcomponent. - Connect the
Text tagcomponent to theData outputcomponent as shown below.
Displaying the angle between elements in the viewer
You can display the angle(s) between elements to show rotation and geometrical properties.
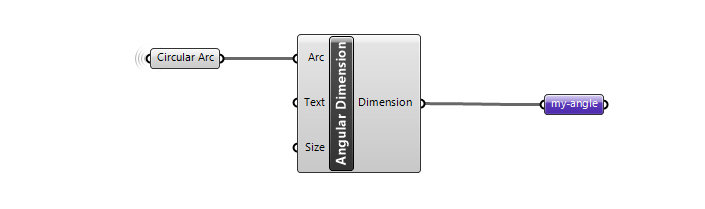
- Define the lines for displaying the intersection angle in Grasshopper.
- Measure the angle between the lines and draw an arc with the same angle.
- Connect the arc to the
Angular dimensioncomponent. - Connect the
Angular dimensioncomponent to theData outputcomponent as shown below.
Displaying analysis results with coloured mesh
You can display coloured meshes to show deflection and axial stress.
- Define the coloured mesh that should be displayed in Grasshopper.
- Connect the resulting coloured mesh to the
Assign materialcomponent. - Set the material name to “coloured-mesh-material” as shown below❗
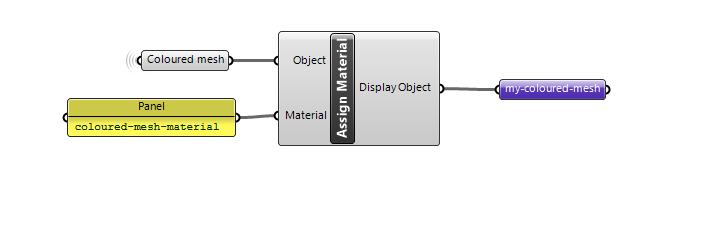
💡 You can connect the resulting mesh from the Karamba3D analysis to the Assign material component.
Displaying legends for coloured meshes
You can use the components above to display legends for coloured meshes.
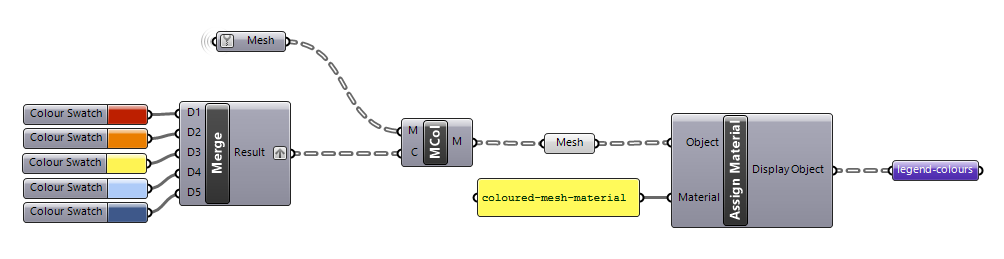
- Model the legend areas as meshes in Grasshopper.
- Define the legend colours.
- Create a coloured mesh using the
Mesh colourscomponent. - Connect the resulting coloured mesh to the
Assign materialcomponent. - Set the material name to “coloured-mesh-material” as shown below❗
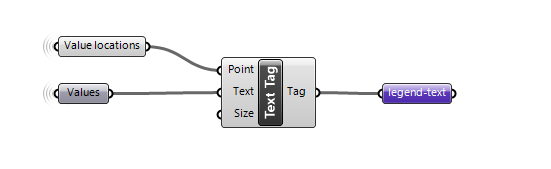
- Define the values for legend areas.
- Model the point locations of labels on the legend.
- Connect the values and the point locations to the
Text tagcomponent. - Connect the
Text tagcomponent to theData outputcomponent as shown below.
Next Steps
Create your model and upload it to Packhunt as usual to view it online.