How to show analysis results
Introduction
Would you like to show simulation results with gradient colors on a surface for structural, daylight or any analysis results? Then display colored meshes by following these steps.
Prerequisites
- You configured the frames and routes for your solution.
- You configured the relevant contents such as the model(s), control panel(s), viewer(s) and datastore.
- You have a Rhino Grasshopper definition with your solution logic.
1. Output coloured mesh
To display analysis results with gradient colors, output colored meshes.
- Create colored meshes.
-
Some plugins like Karamba3D have components that output analysis results as colored meshes.

-
Use the Grasshopper mesh colors component to define a colored mesh based on your analysis logic.
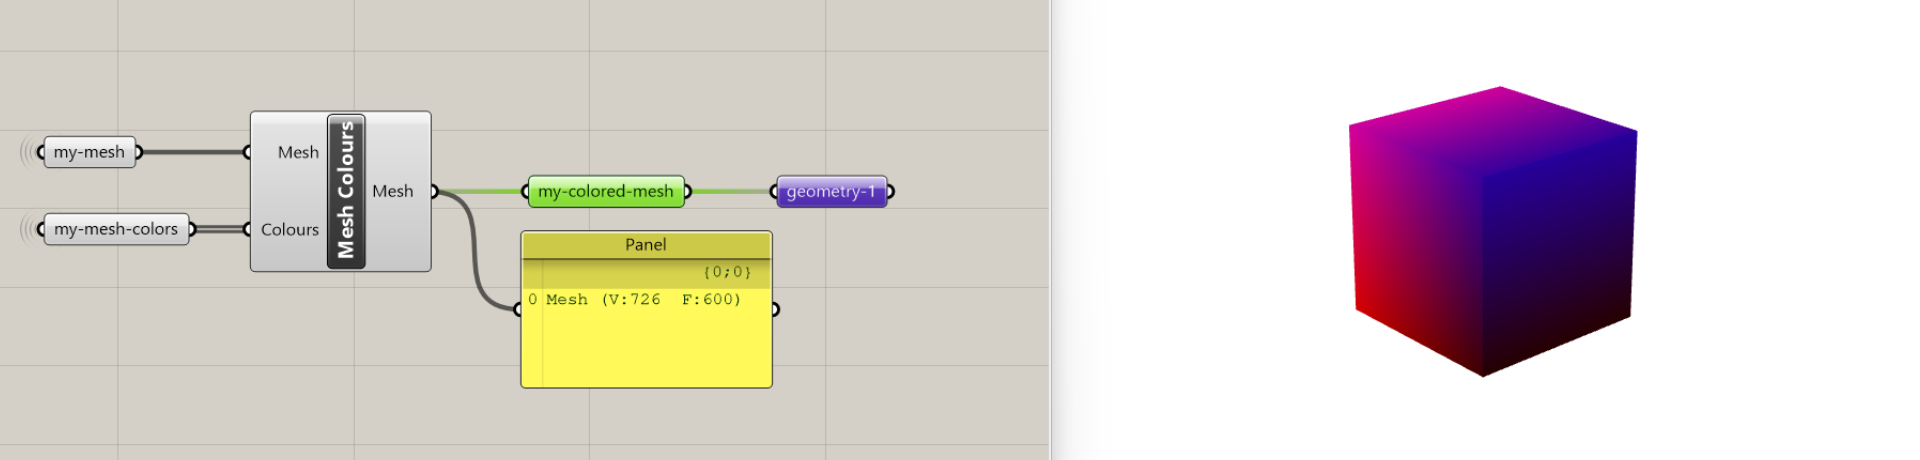
-
- Connect the colored mesh to the Packhunt
Data Outputcomponent.
2. Define colored mesh material
To assign materials to the incoming geometries, the materials should be defined in the Viewer configuration.
- Define your materials with
kind: ColouredMeshMaterial.
The configuration should look similar to the example below:
viewer:
  kind: Viewer
  materials:
    my-colored-mesh:
      kind: ColouredMeshMaterial
3. Assign materials
To define the materials the geometries are displayed with, assign materials.
- Under the
ViewertoModelsubscription, assign materials to the incoming geometries with theassignMaterialproperty.
The configuration should look similar to the example below:
viewer:
  kind: Viewer
  my-colored-mesh:
    kind: ColouredMeshMaterial
  subscribe:
    - kind: Model
      frame: main-frame
      source: model
      assignMaterials:
        geometry-1: my-colored-mesh
Configuration
See the material configuration docs and ViewerModelSubscription configuration docs for more information.